
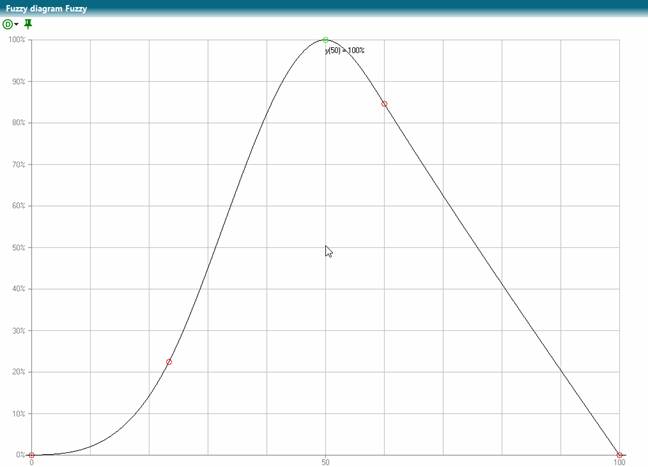
Fuzzy diagrams are the basis for statistical rule check. The boolean algebra only knows True and False as a result of expression. Here, probability diagrams can be made, which return a truth value between 0 and 1 (0%-100%).
The probability curves are constructed with cubic splines.
On runtime a defined fuzzy diagram is represented by a fuzzy variable of same name.
The fuzzy variables return the probability value of the chart for a given X value (the fuzzy value). Fuzzy variables have a set of attribute functions to manipulate the diagram, for example re-setting the X range or giving the diagram another Y offset.
With a set of fuzzy functions fuzzy variables can be compared. For example, it is possible to get the best matching fuzzy variable for a given X value.
Because the diagrams are normalized to values between 0 and 100 in Y direction, it is very easy to use those diagrams even for other purposes, for example technical curves.
See also
 Contents
 Index
Index Previous
 Next
Next