
A fuzzy diagram reflects the relationship between an X value and a related probability (Y value).
The vertices can be edited when the “Edit Vertices switch” is turned on.

By clicking on the curve of the diagram, additional vertices can be added and by right clicking on an existing vertex, it can be removed.
Setting the minimum and maximum value the range of the diagram is set.
|
Property |
Description |
|
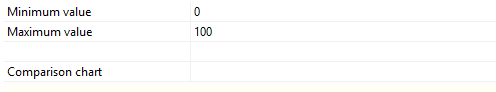
Minimum value |
Value of the smallest X value of the chart |
|
Maximum value |
Value of the largest X value of the chart |
|
Comparison chart |
Display an overlayed fuzzy diagram of the class. The curve is drawn in green color. |
See also
 Contents
 Index
Index Previous
 Next
Next